

3 popular candlestick patterns for forex trading strategy
Candlestick patterns are one of the most reliable indicators of capital market trends, according to Investopedia, and can be used to generate accurate trading signals. This article explains common types of patterns you can use in your trading, and it’s simpler than you might think.
There are dozens of candlestick patterns; here, we’ll present 3 of the most popular patterns which include Hammer, Inverted hammer, Shooting star, and Doji. These patterns typically occur during crucial turning points in the market and could provide valuable information about the direction of future price movements.
While candlestick patterns are relatively straightforward, it’s important to remember that they should be used alongside other technical indicators. This will help to confirm the signal and increase your chances of success. With a bit of practice, you’ll be able to identify these patterns and use them to your advantage, complexity-free.
1) Hammer and Inverted Hammer
The hammer and inverted hammer are both bullish reversal patterns. They occur when the market falls while the bulls stepping-in and push prices back up. The key difference between these two patterns is that the inverted hammer has a small body and a long upper shadow, while the hammer has a small body and a long lower shadow.
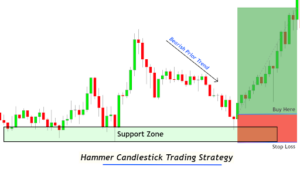
How to use the hammer and inverted hammer pattern strategy?
The hammer and inverted hammer strategy can be used on any timeframe, but it’s most effective on the 1-hour chart. To trade this strategy, you should look for a candlestick with a small body and a long shadow.
The shadow should be at least twice the length of the body. Once you’ve found such a candlestick, you might consider entering a long position at the opening of the next candlestick.
That is where the stop-loss tool comes in handy as part of a wholesome trading strategy. Combining indicator analysis and aware risk management is the proper way to engage in trading. If you do choose to use stop loss here it should be placed below the low of the hammer or inverted hammer candlestick.
What are the benefits of using the hammer and inverted hammer pattern strategy?
One of the main benefits of using this strategy is that it can help you enter the market at an attractive price. The long shadow indicates that there has been significant buying pressure, which means that prices will likely continue increasing.
Another benefit of this strategy is that it’s relatively simple to identify. This makes it ideal for beginners just starting in the currency pair market.
Better your performance with Klips’ trading tools. Start Trading now>>
2) Shooting Star
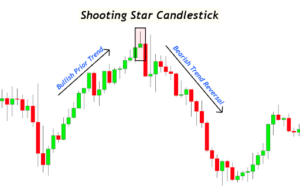
The shooting star is a bearish reversal pattern that occurs after an uptrend. It’s characterised by a small body and a long upper shadow, which indicates that the bears are starting to take control of the market.
How to use the shooting star pattern strategy?
The pattern is composed of two candlesticks, with the first candlestick being a long white candle followed by a short black candle with a small body.
The key feature of the pattern is that the short black candle needs to close below the midpoint of the long white candle. The Shooting Star pattern is most effective when seen after an extended uptrend. When used correctly, it can be utilised to enter a short position or place a take-profit order on an existing long position.
To trade the Shooting Star pattern, traders will typically watch for the following signals:
- 1) A strong uptrend
- 2) A long white candlestick
- 3) A short black candlestick closes below the midpoint of the long white candle. If these conditions are met, traders will then enter a short position at the opening of the next candlestick.
Stop-loss orders should be placed just above the high of the long white candle, and take-profit orders should be placed at prior support levels if you also choose to incorporate these tools.
What are the benefits of using the shooting star pattern strategy?
The key features of the shooting star pattern are a small body with a long upper shadow and a small lower shadow.
The small body indicates that there is not much definitive momentum in either direction, but the long upper shadow suggests significant selling pressure at the highs.
Based on this information, bullish trade on a stock derivative may initiate a long position when the stock price starts to move back above the candle’s open price with the long upper shadow.
While there is no guarantee that the stock will continue to move higher, the shooting star pattern can be a helpful tool for those looking to take advantage of an emerging trend reversal.
3) Doji Pattern
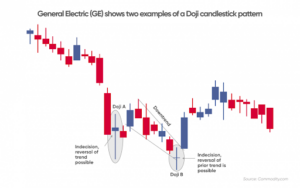
The Doji is a neutral pattern at the bottom or top of a trend. It’s characterised by equal highs and lows, which indicates that there’s indecision in the market. This pattern can be used to confirm reversals or generate signals on its own.
How to use the Doji pattern strategy?
The term “Doji” refers to a class of candlestick patterns that share a common feature: the opening and closing prices are equal or very close. The resulting candlestick looks like a cross or plus sign. Because there is tiny price movement, the Doji indicates that the bulls and bears are evenly matched, and neither side can gain an advantage.
Better your performance with Klips’ trading tools. Start Trading now>>
There are four main types of Doji patterns:
- The long-legged Doji
- The dragonfly Doji
- The gravestone Doji
- The four-price Doji.
Each class has slightly different implications for market direction. For example, a long-legged Doji that forms after an uptrend may signal that the bulls are losing momentum and that a reversal is likely. In contrast, a dragonfly Doji that forms after a downtrend may signal that the bears are losing steam and that a rally is about to begin.
Traders can use Doji patterns and other technical indicators to form reversal trading strategies. For instance, one method might involve waiting for a Gravestone Doji to form at the end of an extended downtrend, then placing a buy order when the stock breaks above the candlestick’s open price.
While Doji patterns can be valuable tools for trading decisions, it’s always recommended to compare their insight with other trading indicators to fully consider the big picture.
Conclusion:
To sum up, when talking about candlestick patterns, the above three are used mainly by traders. The shooting star is a pattern that indicates a potential reversal in the market, while the Doji is a neutral pattern that can be used to confirm reversals or generate signals.
Naturally, it’s essential to use them in conjunction with other technical indicators to form a complete trading strategy that maximises the information these patterns provide.
Disclaimer: Our content is intended to be used for informational purposes only. It is very important to do your own research before making any investment based on your own personal circumstances. You should take independent financial advice from a professional in connection with, or independently research and verify, any information that you find on this article and wish to rely upon, whether for the purpose of making an investment decision or otherwise. Klips does not put available shares or any other underlying asset, but CFD derivatives based in underlying assets.

This information is written by Klips. The information is provided for general purposes only and does not consider any personal circumstances or objectives. Before acting on this material, you should consider whether it is suitable for your circumstances and, if necessary, seek professional advice. No representation or warranty is given as to the accuracy or completeness of this information. It does not constitute financial, investment or other advice on which you can rely. Any references to past performance, historical returns, future projections, and statistical forecasts are no guarantee of future returns or future performance. Klips will not be held responsible for any use that may be made of this information and for any consequences that may result from such use. Hence, any person relying on the information on this page does it at their own risk.
Learn more, understand the markets
Learn

Top AI Companies to Watch: A Deeper Dive
ByAndreea
Learn

Charting Your Course to Trading Success with Klips
ByAndreea
Learn

Navigating the ECB’s Monetary Policy with Klips: Empowering Your Trading Strategy
ByAndreea
Learn

Harness the Power of Dollar-Cost Averaging on Klips Trading Platform Amidst a Bear Market
ByAndreea
Learn

Blockchain: The Future of Finance?
ByAndreea
Learn

AMC stock price – What Influences it the most
ByAdmin
Learn

What are trading signals?
ByAdmin
Trading
3 popular candlestick patterns for forex trading strategy
ByAdmin
Trading

Learn how simple forex trading is in South Africa
ByAdmin
Trading

The Warren Buffet of India: Find Out How Rakesh Jhunjhunwala Built His Fortune
ByAdmin

