

What is technical analysis & how to use it

According to a 2022 market report released by Allied Market Research (AMR), the global online trading market is expected to grow from an estimated $8.9 billion in 2021 to $18.4 billion by 2031 (1), growing at a CAGR of 7.8% from 2022 to 2031. The influx of retail traders during the pandemic gave a boost to this market. There were several instances when retail traders managed to move markets in the opposite direction to the speculations of institutional investors. Price movements in the global financial markets may seem erratic, they are often a part of an underlying pattern. This is where technical analysis comes in, as it is based on identifying underlying patterns in past price movements to make predictions on future movements. So, let’s try to understand what technical analysis is and how to start trading with it.
What is technical analysis?
Technical analysis involves using past market data to identify trends and make predictions of future price movements. Price charts are used to identify the pattern and trends in past price movements, with the objective of identifying trading opportunities. Analysing market activity with the help of price charts not only helps make predictions, but also enables traders to identify support and resistance levels as well as warning signs to avoid. The good news is that there are several technical indicators that help with identifying past price patterns and can be used for future predictions.
Did you know?
Some of the best technical indicators are free and can be incorporated into price charts with a simple drag and drop.
The 3 pillars of technical analysis
Technical analysis is built on three main assumptions:
#1 – The market discounts everything: Also known as the efficient market hypothesis, the premise is that everything that affects an asset is reflected in its price. For instance, the US dollar may be impacted by the rate of economic growth, the Federal Reserve’s interest rate hike decisions, the state of the US labour market and the Presidential elections. At every given point in time, the value of the US dollar will reflect all past economic data and political or other events that influence the currency. This means a trader can simply focus on the past values of the US dollar and cut out all the noise in terms of economic and political announcements.
#2 – Prices tend to move in trends: Although prices can be highly volatile or seem to fluctuate without any pattern during a particular period, price movements tend to follow specific trends when seen over a much longer period on the price chart.
#3 – History repeats itself: This suggests that patterns on the price chart of an asset are likely to be repeated in due course.
Top Tip
Analyse charts across multiple timeframes, like intraday, hourly charts, and daily charts, to understand price movements better and gain more confidence about the formation of a pattern.
Trade smart. Trade with Klips. Start now>>
Why use technical analysis?
Broadly speaking, there are basically two techniques to market analysis or ways to analyse an asset and make predictions about its future price movements. One is technical analysis and the other is fundamental analysis. When using fundamental analysis to identify trading opportunities, a trader focuses on the asset’s “true value” or the most justified price of the asset. For this, the trader needs to study all the forces that influence the price of the asset, whether intrinsic or external, to determine whether the current price is higher or lower than the price at which the asset should ideally be selling. These influencing factors include both intrinsic and external factors and may be very different for different asset classes.
On the other hand, technical analysis strips all the noise and allows traders to focus only on historical price movements. Moreover, technical analysis techniques remain the same across asset classes.
Top Tip
Even when using technical analysis, it’s good to know which factors affect the price of the instrument you’re trading, as this will allow you to look at how the market typically moves during such events.
How to use technical analysis?
Here are the initial steps to begin trading with technical analysis:
Step 1: Identify the chart type
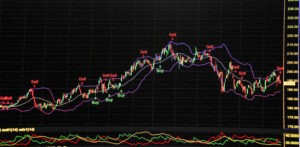
While line and bar charts are available on trading platforms, the most popular is candlestick charting. This is because candlesticks give traders the most important information at a glance. The highest point of a candlestick indicates the highest price at which the instrument is traded during the chosen timeframe, while the candlestick’s lowest point indicates the lowest price. The body of the candlestick shows the opening and closing prices, while the colour indicates whether the price movement was upward or downward.
Top Tip
Price charts are available in different timeframes. Traders typically choose 1-minute, 5-minute, 15-minute or hourly charts, while long-term investors study 4-hour, daily or monthly charts.
Step 2: Choose the best technical indicators
Technical indicators play a key role in identifying an ongoing trend in the pricing chart as well as in determining whether the trend is likely to continue or reverse. While the choices are practically endless, moving averages are considered the best technical indicators for beginners, which makes them the most widely used option. Apart from simple and exponential moving averages (EMA), the other popular indicators are Stochastic Oscillators, Bollinger Bands, Ichimoku cloud, and Fibonacci retracement.
Most traders use two or three of these best technical indicators to make sense of price charts. Many traders combine trend indicators with momentum indicators like RSI. Combining trendlines with volume indicators will help you determine the potential entry and exit prices for an asset.
Top Tip
Use a demo account to try out different technical indicators to choose your best ones and formulate your trading strategy.
Step 3: Identify support and resistance levels
Support and resistance levels form a range within which prices tend to move. In a bear market, the support level is a price at which the asset price stops falling. In a bull market, the resistance level is a price at which the asset price stops rising. It’s important to know the support and resistance levels as price movements are most likely to reverse at these price points. Technical indicators can be used to determine support and resistance levels.
Put your skills to work. Start trading now>>
Top Tip
If the price breaks through a support or resistance level, it tends to continue in that direction for a while.
After you have determined the market trend and identified exit and entry points, it’s also important to decide on position sizing or the amount of money you will open the trade with. This will depend on your financial goals and risk appetite.
Learn the Terms
Market trend: This refers to the tendency of an asset to move in a particular direction.
RSI: Relative Strength Index is a momentum indicator that measures the magnitude of price changes to help traders determine whether the asset is overbought or oversold.
Bollinger bands: These are technical tools that chart out prices and volatility of an asset over a period of time. They create an envelope of upper and lower price range levels.
Disclaimer: Our content is intended to be used for informational purposes only. It is very important to do your own research before making any investment based on your own personal circumstances. You should take independent financial advice from a professional in connection with, or independently research and verify, any information that you find on this article and wish to rely upon, whether for the purpose of making an investment decision or otherwise. Klips does not put available shares or any other underlying asset, but CFD derivatives based in underlying assets.

Widen your technical knowledge and grow your skills
Learn more, understand the markets
Learn

Top AI Companies to Watch: A Deeper Dive
ByAndreea
Learn

Charting Your Course to Trading Success with Klips
ByAndreea
Learn

Navigating the ECB’s Monetary Policy with Klips: Empowering Your Trading Strategy
ByAndreea
Learn
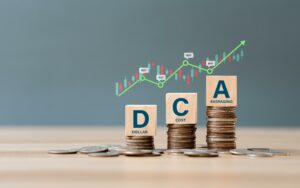
Harness the Power of Dollar-Cost Averaging on Klips Trading Platform Amidst a Bear Market
ByAndreea
Learn

Blockchain: The Future of Finance?
ByAndreea
Learn

AMC stock price – What Influences it the most
ByAdmin
Learn

What are trading signals?
ByAdmin
Trading
3 popular candlestick patterns for forex trading strategy
ByAdmin
Trading

Learn how simple forex trading is in South Africa
ByAdmin
Trading

The Warren Buffet of India: Find Out How Rakesh Jhunjhunwala Built His Fortune
ByAdmin

